

In 2026, Amazon is no longer just a marketplace—it’s a data battlefield. Sellers who win aren’t just those with great products, but those who understand their numbers deeply and act on them fast.
After working in Amazon growth and PPC for over a decade, one thing is clear:
👉 Most sellers don’t fail because of poor products—they fail because they don’t use their data properly.
If you’re generating anywhere between $100K to $50M annually, mastering Amazon sales data can unlock predictable growth, higher profitability, and smarter scaling.
This guide will show you how to analyze Amazon sales data step-by-step, extract actionable insights, and use them to scale your business—with proven strategies used by experts at EcomRanker.
Why Amazon Sales Data Analysis Matters
Amazon gives you access to one of the richest datasets in eCommerce—but only if you know how to use it.
Here’s what proper data analysis helps you achieve:
📈 Increase Profitability
Identify:
- High-margin products
- Loss-making SKUs
- Cost leakages
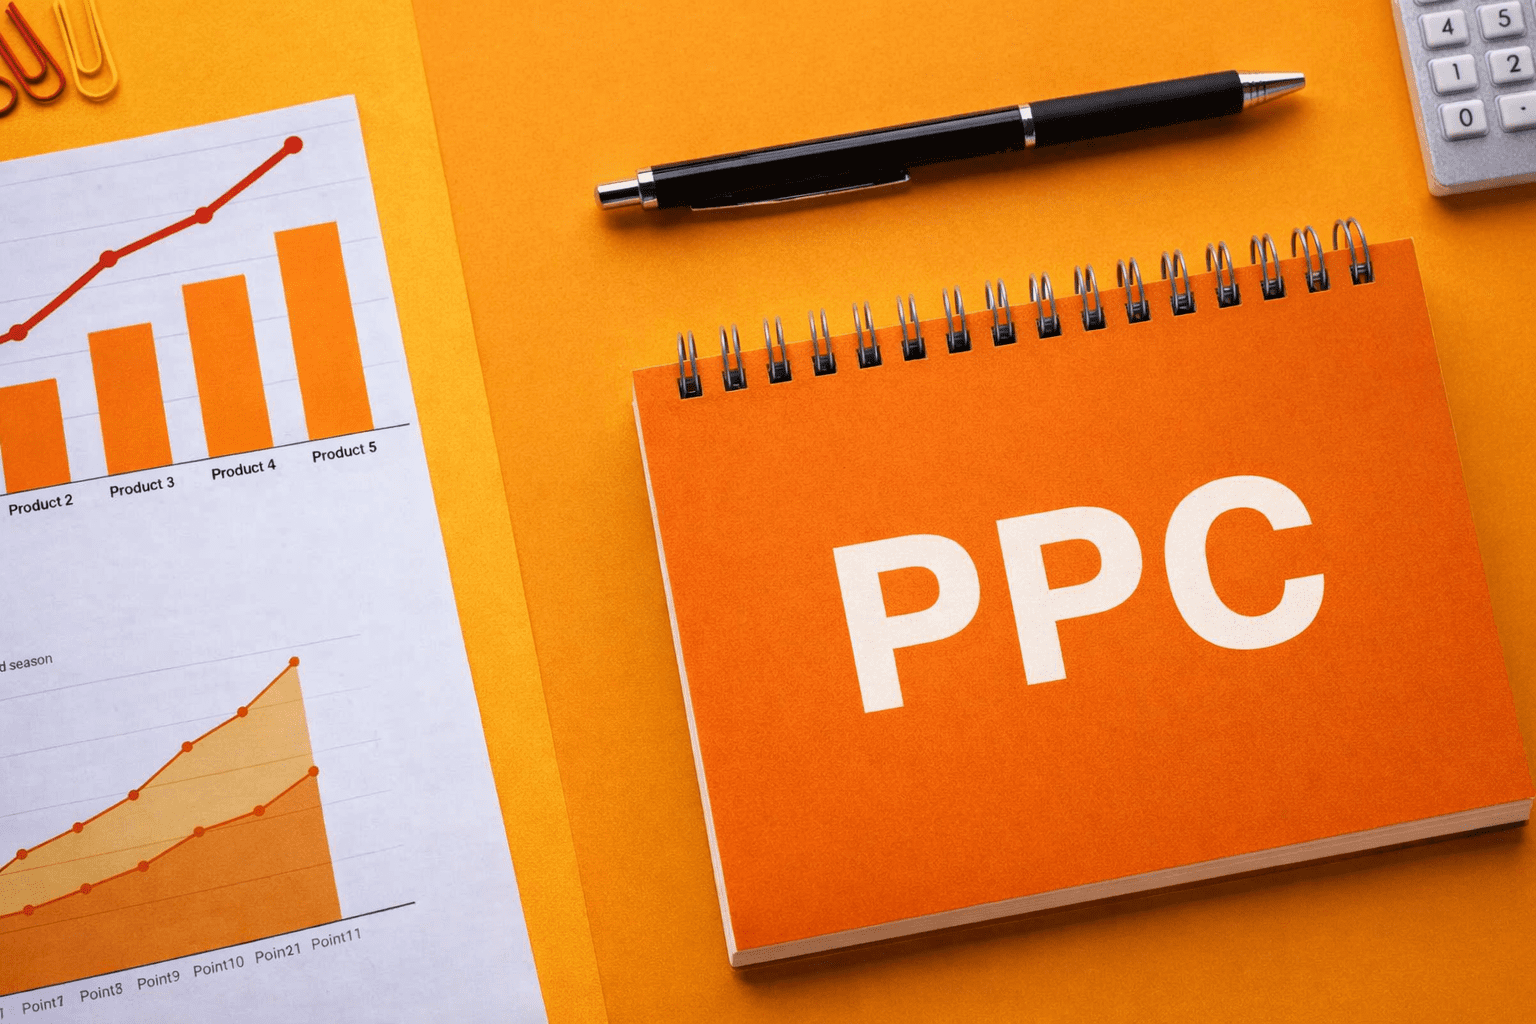
🎯 Optimize Advertising Performance
- Find high-converting keywords
- Cut wasted ad spend
- Improve ROAS & lower ACOS
📦 Improve Inventory Planning
- Avoid stockouts
- Reduce dead inventory
- Forecast demand accurately
🧠 Stay Ahead of Competitors
- Track pricing trends
- Monitor reviews
- Identify market gaps
The Hidden Cost of Ignoring Amazon Data
Ignoring your data is one of the most expensive mistakes you can make.
🚫 What Happens:
- Overspending on ads
- Stockouts during peak demand
- Overstocking slow-moving products
- Low conversion rates
💸 Real Impact:
Brands that don’t analyze data properly often lose:
- 20–40% of potential profit
- Massive growth opportunities
👉 Data is not optional anymore—it’s your growth engine.
How to Access Amazon Sales Data (Step-by-Step)
Step 1: Login to Seller Central
Go to your Amazon Seller account.
Step 2: Navigate to Reports
📊 Business Reports
- Reports → Business Reports
- Key report: Detail Page Sales & Traffic by Child Item
📢 Advertising Reports
- Reports → Advertising Reports
- Track PPC performance
Step 3: Download Reports
- Choose date range
- Export as CSV
- Analyze in Excel / tools
Step 4: Use Brand Analytics (Advanced)
If you’re brand registered:
- Customer search terms
- Market basket data
- Demographics
Step 5: Use API (Advanced Scaling)
For large sellers:
- Automate via SP-API
- Integrate with BI tools
Best Practices for Organizing Amazon Data
1. Segment Your Data
Break it down by:
- ASIN
- Category
- Time (daily/weekly/monthly)
2. Normalize Data
- Standardize formats
- Remove duplicates
- Fix missing values
3. Use Visual Dashboards
Turn raw data into:
- Charts
- KPI dashboards
- Trend graphs
4. Focus on Key Metrics
📊 Sales Metrics
- Revenue
- Units sold
- Sales rank
📈 Traffic Metrics
- Sessions
- CTR
- Conversion rate
💰 Advertising Metrics
- ACOS
- ROAS
- CPC
📦 Inventory Metrics
- Sell-through rate
- Inventory age
- Stock levels
5. Set Weekly & Monthly Reviews
- Weekly → Tactical decisions
- Monthly → Strategic planning
Tools for Amazon Sales Data Analysis
🧾 Spreadsheets (Beginner)
- Excel / Google Sheets
- Pivot tables
- KPI formulas
📊 Advanced Analytics Tools
👉 https://ecomranker.com/
- Full-service Amazon growth solutions
- Data-driven strategy
👉 https://ecomranker.com/amazon-ppc-management/
- PPC optimization
- Ad spend tracking
👉 https://ecomranker.com/amazon-seo-services/
- Keyword & listing optimization
- Organic ranking growth
👉 https://ecomranker.com/amazon-account-management/
- Full account analytics & scaling
📚 Recommended Blog Resources
- https://ecomranker.com/blog/amazon-ppc-strategy/
- https://ecomranker.com/blog/amazon-seo-guide/
- https://ecomranker.com/blog/amazon-listing-optimization/
Common Mistakes in Amazon Data Analysis
❌ Data Overload
Trying to analyze everything = confusion
👉 Focus on actionable KPIs only
❌ Inconsistent Reporting
Different formats = bad decisions
👉 Standardize reports
❌ Ignoring External Factors
- Seasonality
- Competitor pricing
- Market trends
Actionable Insights You Can Extract
1. Identify Bestsellers
- Scale ads
- Improve listings
- Increase inventory
2. Fix Underperforming Products
- Adjust pricing
- Improve images
- Bundle products
3. Optimize Ad Spend
- Kill high ACOS campaigns
- Scale profitable keywords
4. Forecast Demand
- Use historical trends
- Prepare for peak seasons
5. Improve Customer Experience
- Analyze returns
- Read reviews
- Fix product issues
6. Geographic Insights
- Target high-performing regions
- Optimize logistics
7. Trend Analysis
- Spot emerging demand
- Launch new products
8. Predictive Analytics (Advanced)
Use AI tools to:
- Forecast sales
- Optimize pricing
- Automate decisions
How EcomRanker Helps You Scale with Data
Analyzing data manually is time-consuming and often inaccurate.
At EcomRanker, we turn your raw Amazon data into profit-driven strategies:
✅ Advanced Data Analytics
- Deep sales insights
- Profit tracking
✅ PPC Optimization
- Reduce wasted spend
- Increase ROAS
✅ Inventory Forecasting
- Prevent stockouts
- Improve cash flow
✅ Competitor Intelligence
- Market positioning
- Pricing strategy
👉 Explore more: https://ecomranker.com/
The Future of Amazon Data Analysis (2026 & Beyond)
🤖 AI-Driven Insights
- Automated recommendations
- Real-time optimization
📊 Predictive Analytics
- Forecast demand before it happens
🔄 Real-Time Dashboards
- Instant decision-making
🎙 Voice Search Data
- New search behavior insights
Conclusion
Amazon sales data is your biggest competitive advantage—if you use it right.
By:
- Tracking the right metrics
- Analyzing trends
- Taking action
You can:
- Increase profits
- Scale faster
- Build a sustainable Amazon business
👉 If you want expert-level execution, partner with EcomRanker and turn your data into growth.
Frequently Asked Questions (FAQs)
1. What is Amazon sales data analysis?
It’s the process of analyzing performance metrics like sales, traffic, and ads to improve business decisions.
2. How often should I analyze data?
Weekly for performance, monthly for strategy.
3. What is the most important metric?
Conversion rate + profit margin.
4. How can I reduce ACOS using data?
Identify low-performing keywords and optimize campaigns.
5. Which tools are best?
Excel (basic), advanced tools like EcomRanker solutions.
6. Can beginners analyze Amazon data?
Yes, start with basic reports and KPIs.
7. What is Brand Analytics?
Amazon tool for customer behavior insights.
8. How does data help inventory?
Prevents stockouts and overstocking.
9. What is predictive analytics?
Using past data to forecast future performance.
10. Why choose EcomRanker?
Because we combine data + strategy + execution for real growth.
🚀 Ready to Scale Your Amazon Business?
👉 Visit: https://ecomranker.com/
👉 Book your growth consultation today
Turn your Amazon data into revenue.


